Digital Function Generator
Apr. 2024

For the final project in one of my computer engineering classes, we were tasked with engineering and building a prototype of any embedded system of our choosing. I chose to design a digital function generator. This is something I've been wanting to do for quite a while, so the class project was a convenient opportunity to try out some of the ideas I've been kicking around for the last few years.
The final system requirements I came up with were:
- Frequency range: 1 Hz to 20 kHz
- Frequency resolution: 1 Hz
- Frequency accuracy: ± 5%
- Waveform shapes: sine, square, triangle
- User interface: must be able to configure frequency and waveform, must show current settings
Main Controller
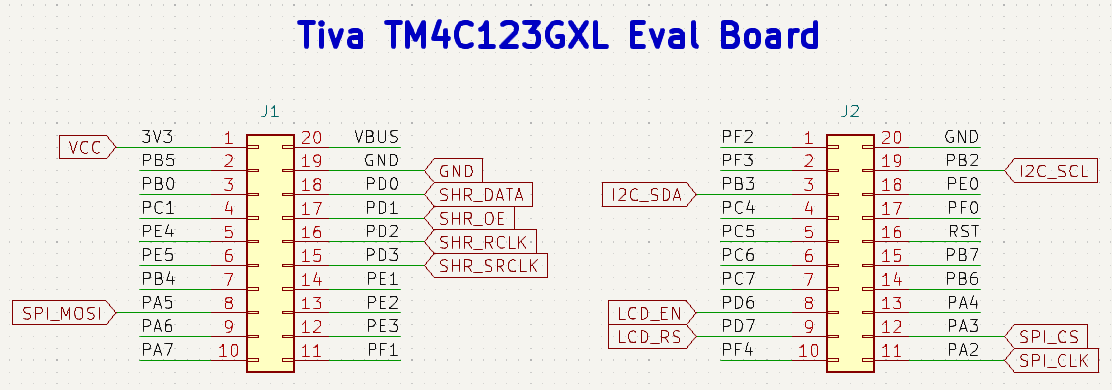
The design is based around the development board we used in other assignments for this class: a Texas Instruments EK-TM4C123GXL evaluation board with a Tiva TM4C123GH6PM microcontroller. I chose to use this board for a few reasons: (1) I already had one, (2) it has a convenient set of expansion headers, and (3) the microcontroller included all the peripherals I needed (SPI, I2C, and several GPIO). All of the necessary pins are exposed on two standard 2.54 mm pin headers.
As for software, I wrote the firmware for the microcontroller in C using Texas Instruments' Code Composer Studio. I utilized the TivaWare driver library and chose to use a foreground-background software architecture. The analog waveform is generated using the direct digital synthesis (DDS) technique which requires a periodic interrupt. This periodic interrupt triggers a DAC update, while the background loop checks the user input state and handles changing waveform parameters.
The sampling rate for a DDS system depends on the maximum output frequency. Since I wanted to be able to generate more than just a sine wave, I needed to account for the higher-frequency components of square and triangle waves. For the best approximation of a square and triangle wave, I wanted to include as many harmonics as possible. The maximum output frequency I chose was 20 kHz, so I aimed for at least the 10th harmonic. After some experimentation, I settled on a sampling rate of 640 kHz. This allows for 32 samples per fundamental period at the highest output frequency, meaning it can include up-to the 16th harmonic. (note: this explanation does not take into account the issue of DAC aliasing/image frequencies).
For a good explanation of DDS and how such a system works, check out this Analog Devices app note.
User Interface
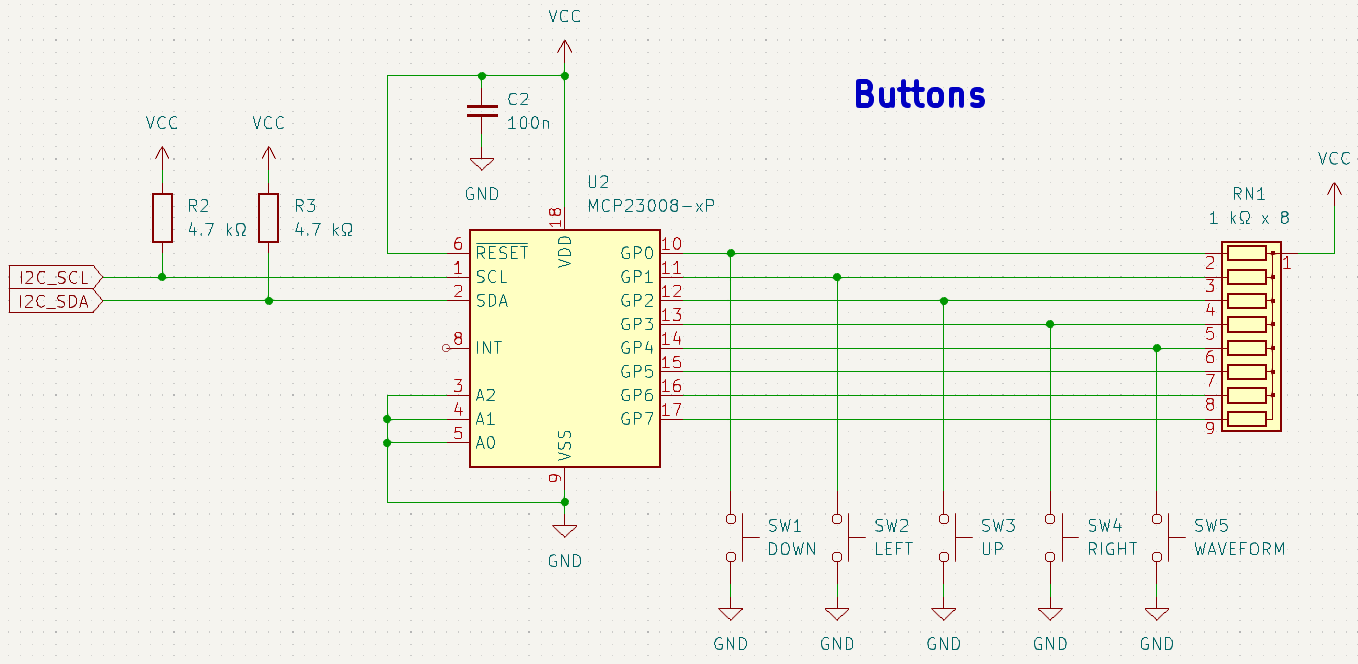
I ended up choosing to use a set of push buttons and a character LCD as the user interface. The buttons are set up as a directional pad, so there are left/right and up/down controls. This lets the user select the digit of the frequency and increment/decrement that digit. There is an additional button which changes the shape of the waveform being generated (sine, square, or triangle).
While figuring out how to implement the buttons, I realized a dedicated chip would simplify the wiring and allow for easier software implementation. I chose to use a Microchip MCP23008 I2C GPIO expander. The GPIO expander pins are configured as inputs, and the microcontroller only has to read the button states over I2C.
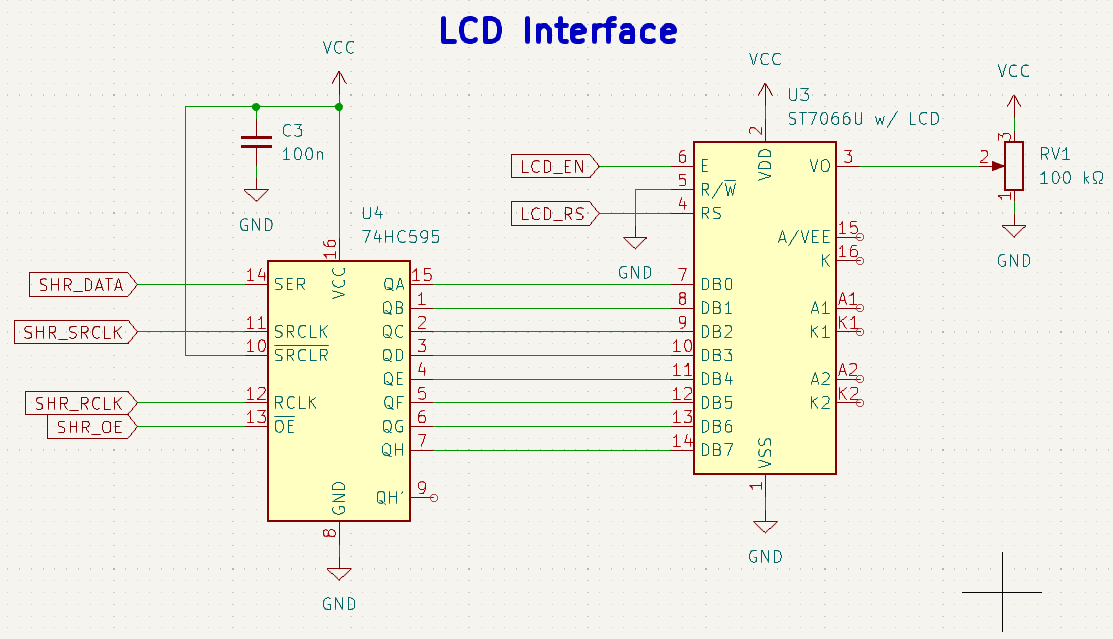
The other half of the user interface is the LCD. I went with a 16x2 character LCD based on the Sitronix ST7066U controller. The ST7066U is drop-in compatible with the Hitachi HD44780U which I already have some experience with. The instruction set is identical, at least for the basic functionality.
Since I didn't want to use any third-party libraries for this project (aside from TI's TivaWare), I opted to write my own driver functions for the ST7066U/HD44780U LCD. This turned out to be quite tricky at first, as there are a few quirks with these chips. For instance, the command to set the instruction width needs be sent several times or the chip may not receive it. Once I figured this out everything else worked perfectly. I had originally planned to use the LCD in 4-bit mode to save some wiring and GPIO pins, but I was unable to make this work reliablly. The LCD would only properly initialize about 5%-10% of the time. Instead I decided to use the full 8-bit parallel bus, which is much easier to implement and worked way more consistently. The only problem is, I ran out of compatible GPIO pins on the microcontroller.
To solve the GPIO count issue, I used TI's version of the 74HC595 serial-to-parallel shift register, allowing me to reduce the required pin count for the LCD interface by about half. Normally, these LCDs use a bidirectional communication bus, but you do not need to read any status registers from the LCD if you operate it slower than necessary. All of the instructions have an upper bound for the timing requirements, so as long as the microcontroller issues commands slower than the required timing, everything works just fine. This is the only reason I was able to use such a unidirectional shift register.
Output Section

For the output section I chose to use a Microchip MCP4812 SPI DAC with an RL low-pass reconstruction filter. I originally planned to include a buffer after the filter in order to make the output capable of driving a 50 Ω load, but I realized (much too far into the project) that I didn't have any 3.3 V capable op-amps and there was not enough time to place a DigiKey order.
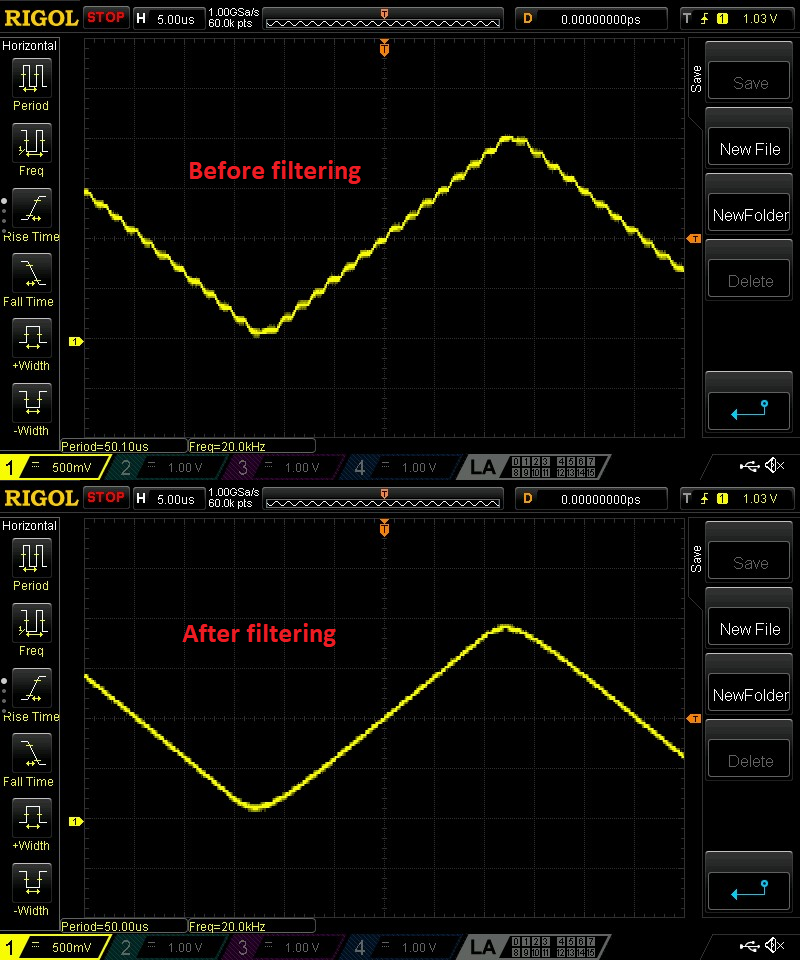
The reconstruction filter is there to remove the sampling noise from the output. Like an ADC, a sampling DAC has the potential to cause aliasing, so there must be a low-pass filter to remove any "image" frequency components. These appear centered around the sampling frequency when viewed on a spectrum analyzer. I chose a desired cutoff frequency of 320 kHz, which attenuates the image frequencies (the worst of which fall between 620 kHz and 660 kHz) while minimally affecting the desired frequency components. The -3dB cutoff frequency of my RL filter is roughly 350 kHz, which is as close as I could get with the selection of passive components I had on hand.
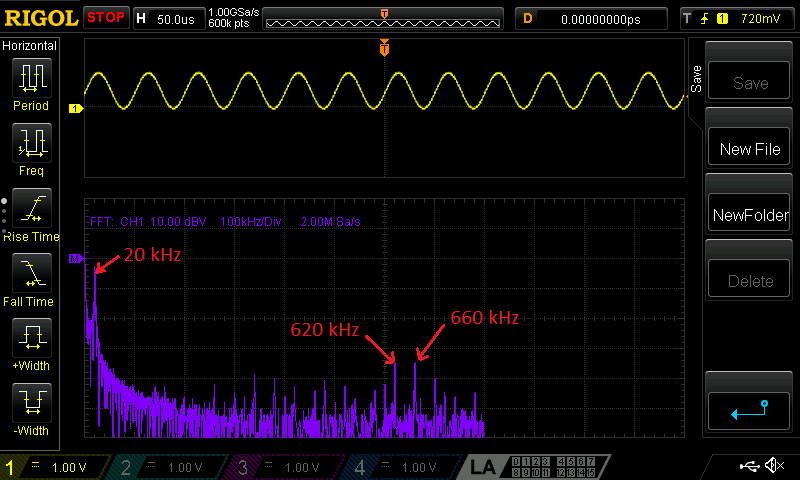
In the screenshot shown, I have the function generator set up to output a 20 kHz sine wave. The oscilloscope is configured to compute the FFT of the incoming signal. Since the waveform has a DC offset (a consequence of not having a buffered output), you can see a spike at 0 Hz. The next spike is the fundamental 20 kHz frequency. On the middle of the FFT plot, there are some frequency components at fs ± f0. These are the image frequencies caused by DAC sampling. I found it interesting that these frequency components somewhat resemble carrier-suppressed amplitude modulation in this case.
Unfortunately though, this filtering comes with its own consequences. Because ideal vertical-cutoff filters don't exist, there will be some attenuation of the desired frequency components. I tried to keep this to a minimum, but it does cause some distortion of the generated waveforms. For example, though the sine wave is not negatively affected, the square wave has softer leading edges and the triangle wave is not as sharp.
